Back to Issues
Issue Reporting
Reports in Toolbox for Issues
Tags:
Toolbox includes built-in reporting on Issues. The data will be updated immediately you add an issue, or Action to your Toolbox project.
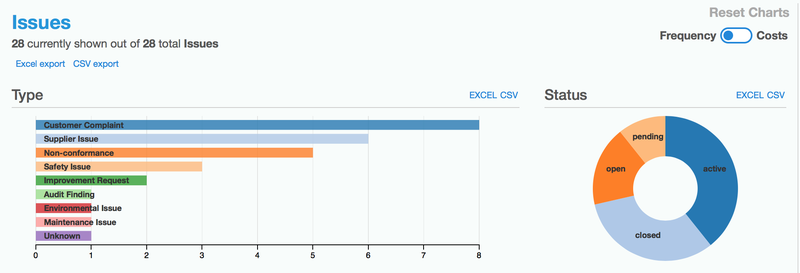
Interactive
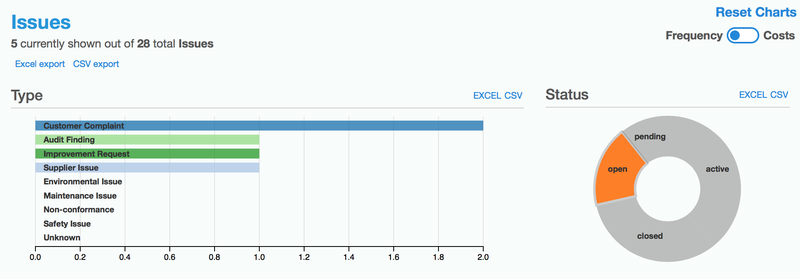
The charts are interactive and will filter the results according to what you click on in the charts. For example, click on 'Open' in the Status pie chart to filter the results to only view Issues in the open state. You can see the Types report has changed and you now see only 5 of the 28 total issues.
Export Chart data.
You can export the chart data by clicking on the EXCEL or CSV links at the top right of each chart. This will give you the processed data to easily reconstruct the chart in your chosen reporting tool so you can make it look exactly how you want.
You can also export the raw issues data for the filter results using the 'Excel export' or CSV export' links at the top of the page under the title.
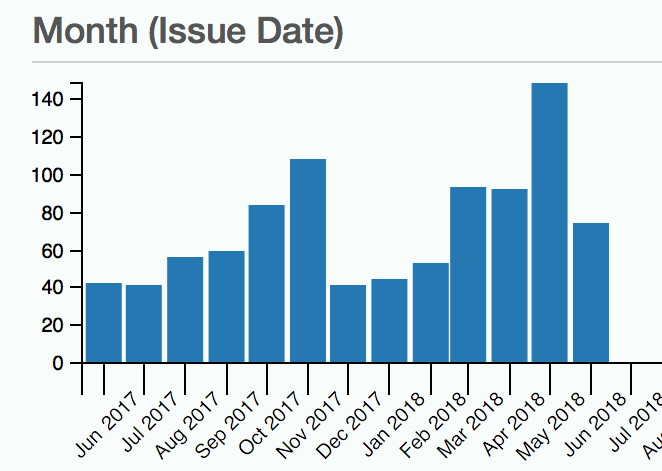
Filter by Date
You can also filter results by date using the timeline chart, Issues by Month:
Click and drag across to select the months you want to report on.
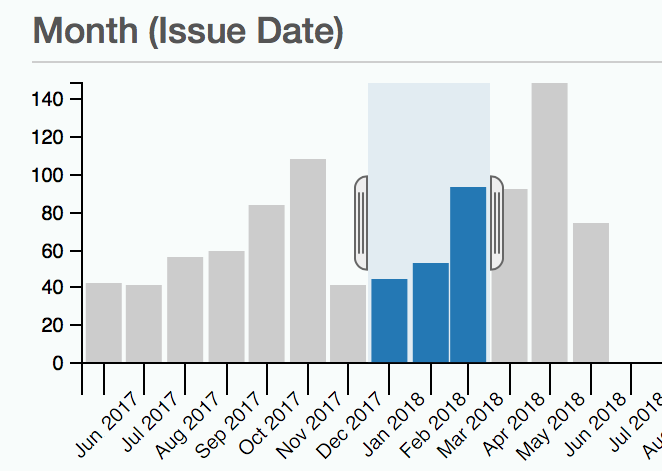
The other charts will immediately adjust to reflect data from the selected months.
Print
Just use your browser's print function to print the reports page.
Permissions
All team members can access reports.