Back to General
Reporting
reports in Toolbox
Tags:
Reports are available automatically in Toolbox for all the modules you have activated.
Click on "Reports" on the right hand side (next to "Worklist"). Then select the module you want to see reporting for.
Charts are interactive and will adjust as you click on different sections to filter the data. Click on "Reset Charts" at the top right to go back to the default set of data.
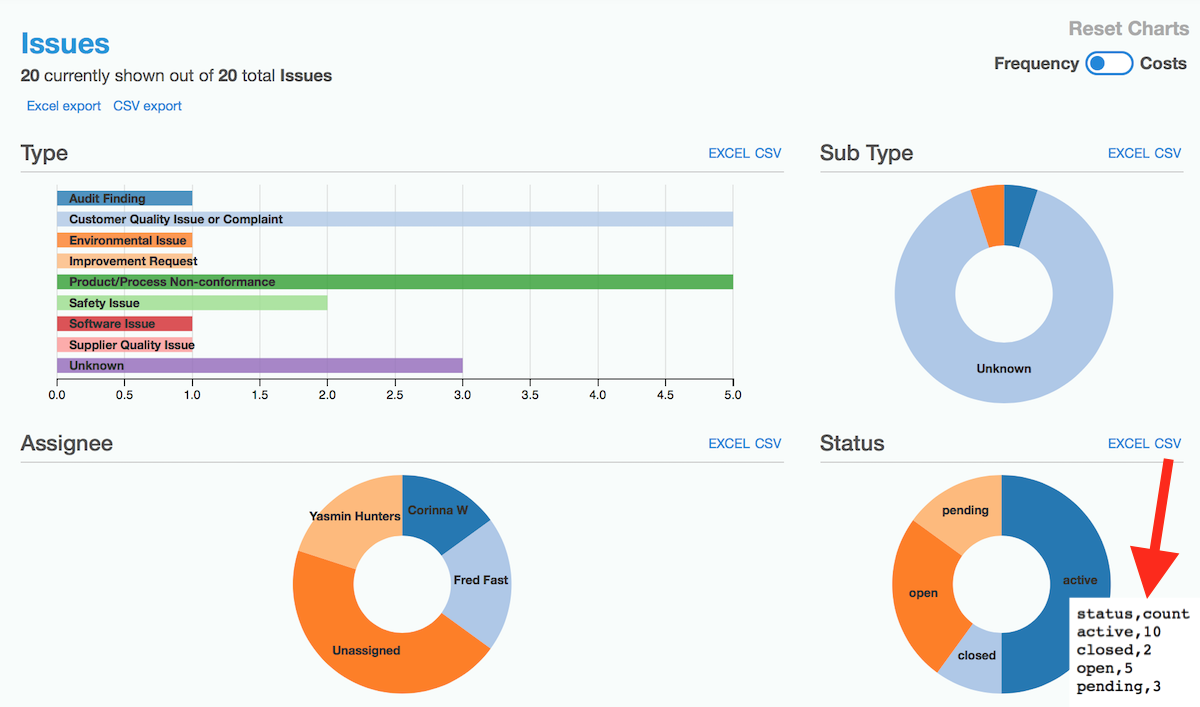
You can export the chart summary data using the 'Excel' or 'csv' links beside the chart.
Get the raw data using the links up near the report title.
Some modules allow reports by cost in addition to count. Set the switch at the top right to change the mode.